TL;DR — Key Takeaways
- Drencher calibration tolerance is plus or minus 5% standard, plus or minus 3% for macrocyclic lactones to prevent resistance.
- Gravimetric method (weight-based) is the gold standard — eliminates temperature and viscosity error from volumetric measurement.
- Three drift causes: peristaltic tubing fatigue, seal wear, and viscosity changes from temperature fluctuations.
- Calibration frequency: monthly minimum, bi-weekly for high-volume or high-value pharmaceutical operations.
- Documentation must be retained 2 years minimum (FDA) or 10 years (EU MDR) for regulatory compliance.
Why Drencher Calibration Accuracy Directly Impacts Your Treatment ROI (and Animal Safety)
In 2020, a large-scale dairy operation in Jiangsu province contacted me about a deworming program that “wasn’t working.” They were using ivermectin at label dose rates, but fecal egg counts weren’t declining as expected. The vet had diagnosed “疑似耐药性” (suspected resistance). The farmer was considering switching to a more expensive moxidectin product.
When I arrived on-site, I calibrated their continuous drencher with a graduated cylinder and stopwatch. The actual output was 62% of target volume. The pump had been drifting for months — nobody had checked. They weren’t dealing with resistance. They were underdosing by 38%.
This is not an isolated case. I estimate that 15-20% of continuous drencher operations in commercial livestock facilities have undetected calibration drift exceeding 10% of target volume. The consequences are serious:
- Underdosing (most common): Treatment failure, possible resistance development, continued parasite burden in the herd
- Overdosing (less common but more dangerous): Drug toxicity, meat/milk withdrawal violations, potential animal mortality
- Financial loss: Wasted pharmaceutical product, labor costs for ineffective treatments, downstream health costs from untreated parasites
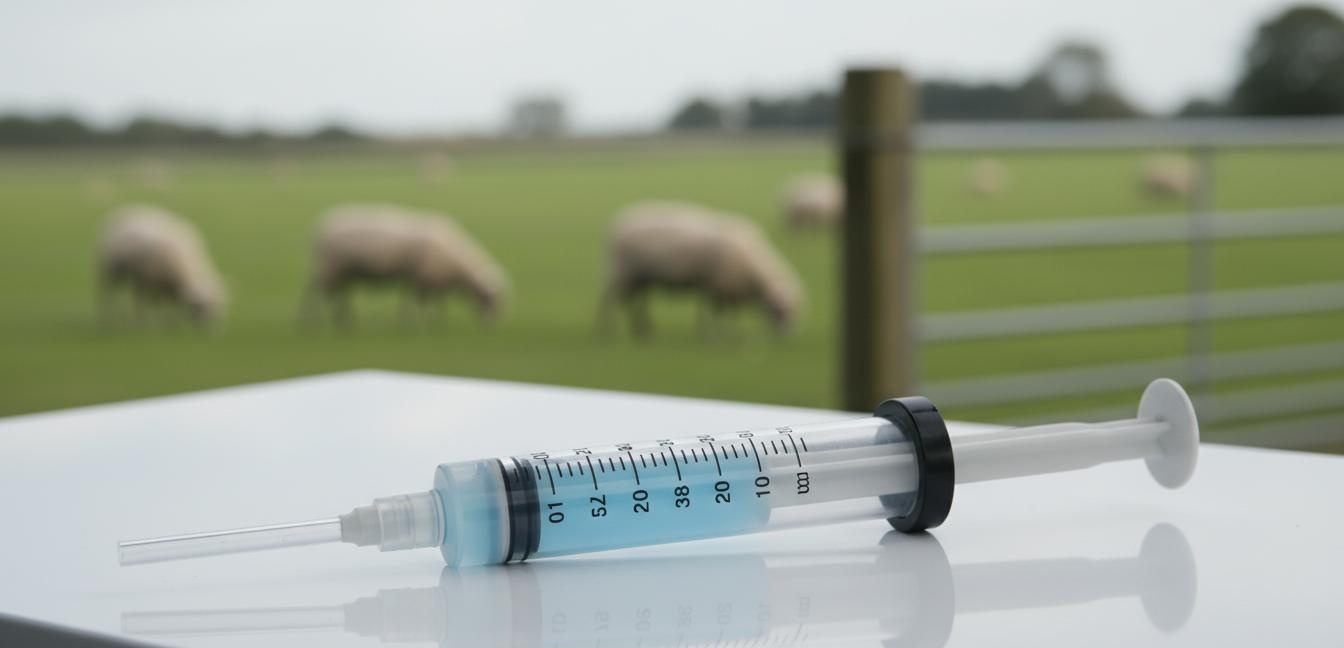
Gravimetric Calibration Method: The Gold Standard for Drencher Volume Verification
The gravimetric method is the most accurate approach for drencher calibration because it measures actual mass output and converts to volume using the known density of water at the test temperature. This eliminates two major error sources in volumetric measurement: liquid thermal expansion/contraction and viscosity-related flow rate variations.
The principle is straightforward: mass (g) divided by density (g/mL) equals volume (mL). At 20 degrees Celsius, water density is 0.997 g/mL. At 35 degrees Celsius, it’s 0.994 g/mL. The difference seems small, but across a 100-head treatment, a 0.3% density error translates to meaningful dose variation.
Pre-Calibration Checklist: What to Inspect Before Starting the Measurement Process
Before you begin the physical calibration, complete these pre-inspection checks:
- Line cleanliness: Flush the system with clean water for 2 minutes. Residue from previous products can affect viscosity and flow characteristics.
- Seal condition: Visually inspect pump seals, O-rings, and valve seats. Cracked, hardened, or missing seals cause backflow and reduce effective output.
- Liquid temperature: Measure the liquid temperature in the drencher reservoir. Record this — it affects density conversion.
- Ambient temperature: Record ambient temperature. If it differs from liquid temperature by more than 5 degC, allow the system to equilibrate for 10 minutes before testing.
- Pressure verification: Confirm the system is operating at normal working pressure. Both under-pressure and over-pressure affect output volume.
Step-by-Step Calibration Procedure: Flow Rate Test and Drift Detection
- Fill drencher reservoir with clean water at operating temperature (same liquid you will use for actual treatments).
- Operate the drencher for 2 minutes to purge air from supply lines and ensure stable flow.
- Place a calibrated collection container (capacity minimum 500 mL) directly at the output port. Ensure the container is dry and tared.
- Start the drencher and simultaneously start the stopwatch. Collect output for exactly 60 seconds.
- At 60 seconds, remove the container immediately and stop the drencher.
- Weigh the collected water on a precision scale with resolution of 0.1g or better. Record the weight in grams.
- Convert to volume: Volume (mL) = Weight (g) divided by Density (g/mL at measured temperature).
- Calculate flow rate: Flow rate (mL/min) = Collected Volume (mL) divided by 60 (seconds) multiplied by 60 = Collected Volume (mL).
- Compare to expected flow rate from manufacturer specifications or your treatment protocol.
- Calculate error percentage: Error (%) = ((Measured minus Expected) divided by Expected) multiplied by 100.
- Repeat the collection and measurement two more times. Average the three measurements.
Drift Mechanisms: Why Continuous Pump Drifts Over Time and How to Detect It Early
Understanding why pumps drift helps you diagnose problems faster and schedule preventive maintenance more intelligently.
1. Peristaltic Tubing Fatigue. The silicone tubing in peristaltic pumps undergoes cyclic compression with every revolution. Over 200-500 operating hours, the tubing permanently stretches and loses its elastic recovery. This reduces the effective volume per compression cycle. The gradual nature of this drift means you may not notice it until the error exceeds 10-15%.
2. Seal Wear. Piston seals, diaphragm seals, and valve seat seals all have finite service lives. As seals lose their compression resilience, small backflow volumes accumulate with each cycle. A seal that has lost 10% of its compression thickness can cause 3-5% output reduction.
3. Liquid Viscosity Changes. Temperature fluctuations of just 5 degC can alter output by 2-4% because fluid resistance changes. If you’re calibrating in the morning (18 degC ambient) but treating in the afternoon (28 degC), your calibration data may be invalid for the actual treatment conditions.
Documentation and Records: Building a Calibration Log That Satisfies Regulatory Audits
A calibration log is not just good practice — it’s a regulatory requirement in most jurisdictions. Here’s what your log should contain:
| Log Field | Required Information | Regulatory Basis |
|---|---|---|
| Equipment ID | Serial number, model, manufacturer | Traceability |
| Calibration date | Date and operator name | All jurisdictions |
| Test conditions | Liquid temperature, ambient temperature, liquid type | Methodology documentation |
| Measured values | Three collection weights, calculated averages, flow rate | Raw data preservation |
| Accept/reject decision | Expected vs measured, error percentage, pass/fail | Decision documentation |
| Corrective action | If failed: root cause, maintenance performed, recalibration result | Nonconformance handling |
| Reference standard verification | Calibration weights traceability certificate date, thermometer calibration date | Measurement integrity |
For EU operations, EU MDR 2017/745 requires documentation retention for a minimum of 10 years for devices used in professional veterinary settings. In the US, FDA 21 CFR Part 820 (Quality System Regulation) requires minimum 2-year retention from the record creation date.
Download: Drencher Calibration Log Template
Pre-built calibration log spreadsheet with automated accept/reject calculation, reference standard tracking, and corrective action fields. Meets FDA 21 CFR Part 820 and EU MDR 2017/745 documentation requirements. Available for Sound-AI distributor partners.
Frequently Asked Questions
Post time: May-18-2026